پرونده:Post-Glacial Sea Level.png - ویکی‌پدیا، دانشنامهٔ آزاد

پروندهٔ اصلی(۱٬۸۱۳ × ۱٬۰۸۸ پیکسل، اندازهٔ پرونده: ۳۷۱ کیلوبایت، نوع MIME پرونده: image/png)

خلاصه

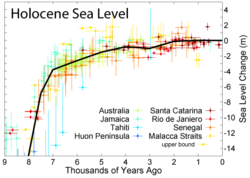
Expansion of the most recent 9 kyr

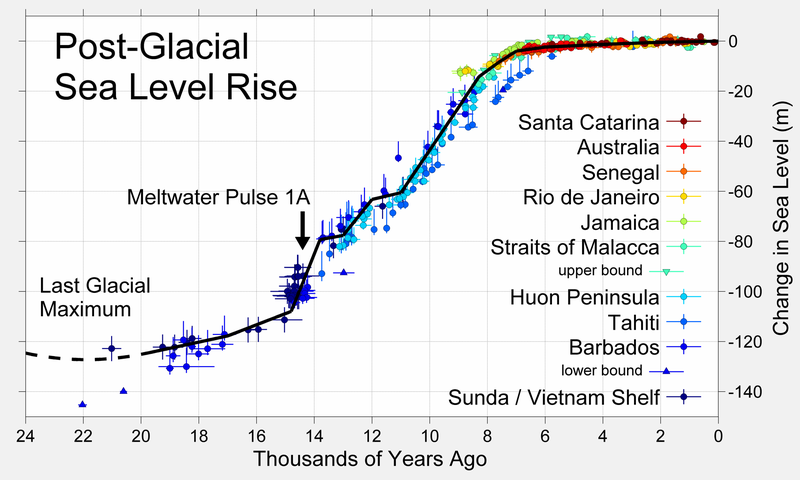
This figure shows sea level rise the end of the last glacial episode based on data from Fleming et al. 1998, Fleming 2000, and Milne et al. 2005. These papers collected data from various reports and adjusted them for subsequent vertical geologic motions, primarily those associated with post-glacial continental and hydroisostatic rebound. The first refers to deformations caused by the weight of continental ice sheets pressing down on the land the latter refers to uplift in coastal areas resulting from the increased weight of water associated with rising sea levels. Because of the latter effect and associated uplift, many islands, especially in the Pacific, experienced higher local sea levels in the mid-Holocene than they do today. Uncertainty about the magnitude of these corrections is the dominant uncertainty in many measurements of sea level change.

The black curve is based on minimizing the sum of squares error weighted distance between this curve and the plotted data. It was constructed by adjusting a number of specified tie points, typically placed every 1 kyr but at times adjusted for sparse or rapidly varying data. A small number of extreme outliers were dropped. Some authors propose the existence of significant short-term fluctuations in sea level such that the sea level curve might oscillate up and down about this ~1 kyr mean state. Others dispute this and argue that sea level change has largely been a smooth and gradual process. However, at least one episode of rapid deglaciation, known as meltwater pulse 1A, is agreed upon, and is indicated on the plot. A variety of other accelerated periods of deglaciation have been proposed (i.e. meltwater pulse 1B, 1C, 1D, 2, 3...), but it is unclear whether these actually occurred or merely reflect misinterpretation of difficult measurements. No other events are evident in the data presented above.

The lowest point of sea level during the last glaciation is not well constrained by observations (shown here as a dashed curve), but is generally argued to be approximately 130 ± 10 m below present sea level and to have occurred at approximately 22 ± 3 thousand years ago. The time of lowest sea level is more or less equivalent to the Last Glacial Maximum. Prior to this time, ice sheets were still increasing in size, so sea level had been decreasing almost continuously for approximately 100,000 years.

Copyright

This figure was prepared by Robert A. Rohde from published data, and is incorporated into the Global Warming Art project.

Image from Global Warming Art
This image is an original work created for Global Warming Art. Please refer to the image description page for more information.
GNU head اجازهٔ کپی، پخش و/یا تغییر این سند تحت شرایط مجوز مستندات آزاد گنو، نسخهٔ ۱٫۲ یا هر نسخهٔ بعدتری که توسط بنیاد نرم‌افزار آزاد منتشر شده؛ بدون بخش‌های ناوردا (نامتغیر)، متون روی جلد، و متون پشت جلد، اعطا می‌شود. یک کپی از مجوز در بخشی تحت عنوان مجوز مستندات آزاد گنو ضمیمه شده است.
w:fa:کرییتیو کامنز
انتساب انتشار مشابه
این پرونده با اجازه‌نامهٔ کریتیو کامانز Attribution-Share Alike 3.0 سازگار نشده منتشر شده‌است.
شما اجازه دارید:
  • برای به اشتراک گذاشتن – برای کپی، توزیع و انتقال اثر
  • تلفیق کردن – برای انطباق اثر
تحت شرایط زیر:
  • انتساب – شما باید اعتبار مربوطه را به دست آورید، پیوندی به مجوز ارائه دهید و نشان دهید که آیا تغییرات ایجاد شده‌اند یا خیر. شما ممکن است این کار را به هر روش منطقی انجام دهید، اما نه به هر شیوه‌ای که پیشنهاد می‌کند که مجوزدهنده از شما یا استفاده‌تان حمایت کند.
  • انتشار مشابه – اگر این اثر را تلفیق یا تبدیل می‌کنید، یا بر پایه‌ آن اثری دیگر خلق می‌کنید، می‌‌بایست مشارکت‌های خود را تحت مجوز یکسان یا مشابه با ا اصل آن توزیع کنید.
این برچسب مجوز به‌عنوان بخشی از روزآمدسازی مجوز GFDL، به این پرونده افزوده شد.


References

  • Fleming, Kevin, Paul Johnston, Dan Zwartz, Yusuke Yokoyama, Kurt Lambeck, and John Chappell (1998). "Refining the eustatic sea-level curve since the Last Glacial Maximum using far- and intermediate-field sites". Earth and Planetary Science Letters 163 (1-4): 327-342. doi:10.1016/S0012-821X(98)00198-8
  • Fleming, Kevin Michael (۲۰۰۰) Glacial Rebound and Sea-level Change Constraints on the Greenland Ice Sheet، Australian National University PhD Thesis
  • Milne, Glenn A., Antony J. Long and Sophie E. Bassett (2005). "Modelling Holocene relative sea-level observations from the Caribbean and South America". Quaternary Science Reviews 24 (10-11): 1183-1202. doi:10.1016/j.quascirev.2004.10.005


این geology نگاره می‌بایست با استفاده از گرافیک برداری اس‌وی‌جی فایل بازسازی شوند. این چند مزیت دارد؛ Commons:Media for cleanup را برای اطلاعات بیشتر ببینید. اگر حالت برداری آن در حال حاضر موجود است، لطفاً آن را بار کنید. پس از بارکردن یک اس‌وی‌جی، این الگو را با {{vector version available|new image name.svg}} جایگزین کنید.

عنوان

شرحی یک‌خطی از محتوای این فایل اضافه کنید

آیتم‌هایی که در این پرونده نمایش داده شده‌اند

توصیف‌ها

تاریخچهٔ پرونده

روی تاریخ/زمان‌ها کلیک کنید تا نسخهٔ مربوط به آن هنگام را ببینید.

تاریخ/زمانبندانگشتیابعادکاربرتوضیح
کنونی‏۱۸ مارس ۲۰۱۹، ساعت ۲۳:۳۶تصویر بندانگشتی از نسخهٔ مورخ ‏۱۸ مارس ۲۰۱۹، ساعت ۲۳:۳۶۱٬۸۱۳ در ۱٬۰۸۸ (۳۷۱ کیلوبایت)Dragons flightHigher resolution version
‏۲۵ نوامبر ۲۰۱۶، ساعت ۱۷:۲۶تصویر بندانگشتی از نسخهٔ مورخ ‏۲۵ نوامبر ۲۰۱۶، ساعت ۱۷:۲۶۵۲۶ در ۳۵۹ (۱۹ کیلوبایت)A876edited to correct spelling. (also OptiPNG.)
‏۲۷ دسامبر ۲۰۰۵، ساعت ۰۲:۲۰تصویر بندانگشتی از نسخهٔ مورخ ‏۲۷ دسامبر ۲۰۰۵، ساعت ۰۲:۲۰۵۲۶ در ۳۵۹ (۲۳ کیلوبایت)AngrenseSea level variation during the last post-glacial period. Source:English version of Wikipedia.

صفحه‌های زیر از این تصویر استفاده می‌کنند:

کاربرد سراسری پرونده

ویکی‌های دیگر زیر از این پرونده استفاده می‌کنند:

نمایش استفاده‌های سراسری از این پرونده.

فراداده