
 French
 Deutsch
Fișier:South Africa 2011 dominant population group map.svg

Mărimea acestei previzualizări PNG a acestui fișier SVG: 684 × 599 pixeli. Alte rezoluții: 274 × 240 pixeli | 548 × 480 pixeli | 876 × 768 pixeli | 1.168 × 1.024 pixeli | 2.337 × 2.048 pixeli | 809 × 709 pixeli.
Mărește rezoluția imaginii (Fișier SVG, cu dimensiunea nominală de 809 × 709 pixeli, mărime fișier: 787 KB)
| Acest fișier se află la Wikimedia Commons. Consultați pagina sa descriptivă acolo. |
Descriere fișier
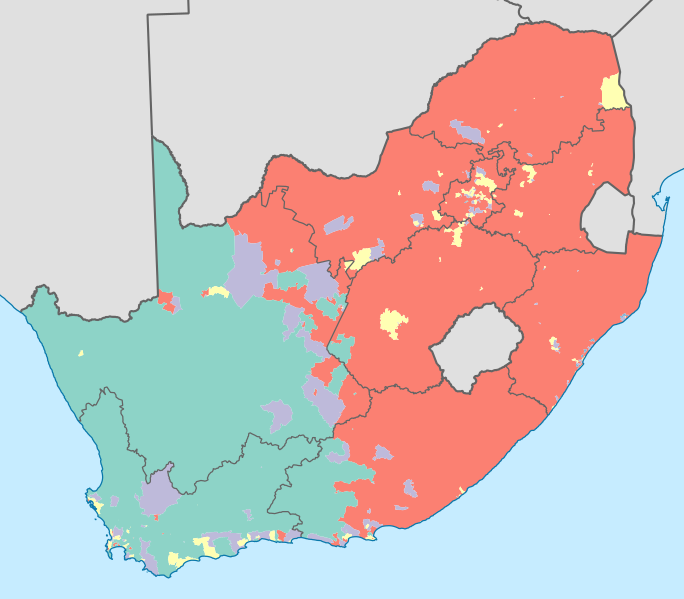
| Descriere | English: Map showing the dominant population groups in South Africa, according to Census 2011, at electoral ward level. A population group is considered dominant if it makes up more than 50% of the population in a ward, or if it makes up more than 33% and no other group makes up more than 25%. Black African Coloured Indian or Asian White No group dominant Projection is Albers Equal-Area Conic, with standard parallels at 25.5° S and 31.5° S, and origin at 28.5° S 25.5° E. |
| Dată | |
| Sursă | Statistics South Africa's Census 2011 is the source of the basic population data. The map results from my own processing of the data. The map results from my own processing of the data. For ward boundaries see File:South Africa electoral wards 2011 blank.svg. |
| Autor | Htonl |
| Alte versiuni | South Africa 2011 dominant population group map (hex cells).svg: .svg) |
Licențiere
The following license applies to the population data on which the map is based:
 | Deținătorul drepturilor de autor ale acestui fișier, Stats SA, permite oricui să-l folosească în orice scop, atâta timp cât opera îi este atribuită. Redistribuirea, lucrările derivate, utilizarea în scop comercial, precum și orice alt tip de utilizare sunt permise. |
Atribuire: "the user acknowledges Stats SA as the source of the basic data wherever they process, apply, utilise, publish or distribute the data, and also that they specify that the relevant application and analysis (where applicable) result from their own processing of the data" [1]
|
The following tag applies to the map itself:
| Eu, deținătorul drepturilor de autor ale acestei opere, o eliberez domeniului public. Aceasta se aplică în întreaga lume. În anumite țări există posibilitatea ca acest lucru să nu fie legal posibil; în acest caz: permit oricui să utilizeze această operă în orice scop, fără nicio condiție, atâta timp cât asemenea condiții nu sunt cerute de lege. |
Istoricul fișierului
Apăsați pe Data și ora pentru a vedea versiunea trimisă atunci.
| Data și ora | Miniatură | Dimensiuni | Utilizator | Comentariu | |
|---|---|---|---|---|---|
| actuală | 17 aprilie 2013 03:13 | | 809x709 (787 KB) | Htonl | =={{int:filedesc}}== {{Information |Description={{en|1=Map showing the dominant population groups in South Africa, according to Census 2011, at electoral ward level. A population group is considered dominant if it makes up more than 50% of the populati... |
Utilizarea fișierului
Următoarele pagini conțin această imagine:
Utilizarea globală a fișierului
Următoarele alte proiecte wiki folosesc acest fișier:
- Utilizare la af.wikipedia.org
- Utilizare la cs.wikipedia.org
- Utilizare la es.wikipedia.org
- Utilizare la fr.wikipedia.org
- Utilizare la he.wikipedia.org
- Utilizare la it.wikipedia.org
- Utilizare la ka.wikipedia.org
- Utilizare la pt.wikipedia.org
- Utilizare la ru.wikipedia.org
- Utilizare la sr.wikipedia.org
- Utilizare la tg.wikipedia.org
- Utilizare la uk.wikipedia.org
- Utilizare la zh.wikipedia.org