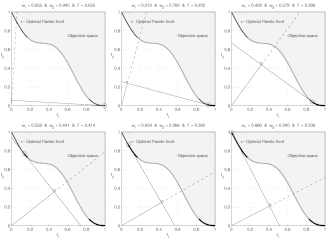
function MO_Animate(varargin) % This function generates objective space images showing why % sum-weighted optimizer can not find all non-dominated % solutions for non convex objective spaces in multi-ojective % optimization % % Guillaume JACQUENOT if nargin == 0 % Simu = 'Convex'; Simu = 'NonConvex'; save_pictures = true; interpreter = 'none'; end switch Simu case 'NonConvex' a = 0.1; b = 3; stepX = 1/200; stepY = 1/200; case 'Convex' a = 0.2; b = 1; stepX = 1/200; stepY = 1/200; end [X,Y] = meshgrid( 0:stepX:1,-2:stepY:2); F1 = X; F2 = 1+Y.^2-X-a*sin(b*pi*X); figure; grid on; hold on; box on; axis square; set(gca,'xtick',0:0.2:1); set(gca,'ytick',0:0.2:1); Ttr = get(gca,'XTickLabel'); Ttr(1,:)='0.0'; Ttr(end,:)='1.0'; set(gca,'XTickLabel',[repmat(' ',size(Ttr,1),1) Ttr]); Ttr = get(gca,'YTickLabel'); Ttr(1,:)='0.0'; Ttr(end,:)='1.0'; set(gca,'YTickLabel',[repmat(' ',size(Ttr,1),1) Ttr]); if strcmp(interpreter,'none') xlabel('f1','Interpreter','none'); ylabel('f2','Interpreter','none','rotation',0); else xlabel('f_1','Interpreter','Tex'); ylabel('f_2','Interpreter','Tex','rotation',0); end set(gcf,'Units','centimeters') set(gcf,'OuterPosition',[3 3 3+6 3+6]) set(gcf,'PaperPositionMode','auto') [minF2,minF2_index] = min(F2); minF2_index = minF2_index + (0:numel(minF2_index)-1)*size(X,1); O1 = F1(minF2_index)'; O2 = minF2'; [pF,Pareto]=prtp([O1,O2]); fill([O1( Pareto);1],[O2( Pareto);1],repmat(0.95,1,3)); text(0.45,0.75,'Objective space'); text(0.1,0.9,'\leftarrow Optimal Pareto front','Interpreter','TeX'); plot(O1( Pareto),O2( Pareto),'k-','LineWidth',2); plot(O1(~Pareto),O2(~Pareto),'.','color',[1 1 1]*0.8); V1 = O1( Pareto); V1 = V1(end:-1:1); V2 = O2( Pareto); V2 = V2(end:-1:1); O1P = O1( Pareto); O2P = O2( Pareto); O1PC = [O1P;max(O1P)]; O2PC = [O2P;max(O2P)]; ConvH = convhull(O1PC,O2PC); ConvH(ConvH==numel(O2PC))=[]; c = setdiff(1:numel(O1P), ConvH); % Non convex O1PNC = O1PC(c); [temp, I1] = min(O1PNC); [temp, I2] = max(O1PNC); if ~isempty(I1) && ~isempty(I2) plot(O1PC(c),O2PC(c),'-','color',[1 1 1]*0.7,'LineWidth',2); end p1 = (V2(1)-V2(2))/(V1(1)-V1(2)); hp = plot([0 1],[p1*(-V1(1))+V2(1) p1*(1-V1(1))+V2(1)]); delete(hp); Histo_X = []; Histo_Y = []; coeff = 0.02; Sq1 = coeff *[0 1 1 0 0;0 0 1 1 0]; compt = 1; for i = 2:1:length(V1)-1 if ismember(i,ConvH) p1 = (V2(i+1)-V2(i-1))/(V1(i+1)-V1(i-1)); x_inter = 1/(1+p1^2)*(p1^2*V1(i)-p1*V2(i)); hp1 = plot([0 1],[p1*(-V1(i))+V2(i) p1*(1-V1(i))+V2(i)],'k'); % hp2 = plot([x_inter],[-x_inter/p1],'k','Marker','.','MarkerSize',8) hp3 = plot([0 x_inter],[0 -x_inter/p1],'k-'); hp4 = plot([x_inter 1],[-x_inter/p1 -1/p1],'k--'); hp5 = plot(V1(i),V2(i),'ko','MarkerSize',10); % Plot the square for perpendicular lines alpha = atan(-1/p1); Mrot = [cos(alpha) -sin(alpha);sin(alpha) cos(alpha)]; Sq_plot = repmat([x_inter;-x_inter/p1],1,5) + Mrot * Sq1; hp7 = plot(Sq_plot(1,:),Sq_plot(2,:),'k-'); Histo_X = [Histo_X V1(i)]; Histo_Y = [Histo_Y V2(i)]; hp6 = plot(Histo_X,Histo_Y,'k.','MarkerSize',10); w1 = p1/(p1-1); w2 = 1-w1; Fweight_sum = V1(i)*w1+w2*V2(i); Fweight_sum = floor(1e3*Fweight_sum )/1e3; w1 = floor(1000*w1)/1e3; str1 = sprintf('%.3f',w1); str2 = sprintf('%.3f',1-w1); str3 = sprintf('%.3f',Fweight_sum); if (strcmp(str1,'0.500')||strcmp(str1,'0,500')) && strcmp(Simu,'NonConvex') disp('Two solutions'); end title(['\omega_1 = ' str1 ' & \omega_2 = ' str2 ' & F = ' str3],'Interpreter','TeX'); axis([0 1 0 1]); file = ['Frame' num2str(1000+compt)]; if save_pictures saveas(gcf, file, 'epsc'); end compt = compt +1; pause(0.001); delete(hp1); delete(hp3); delete(hp4); delete(hp5); delete(hp6); delete(hp7); end end disp(['Number of frames :' num2str(length(V1))]); return; function [A varargout]=prtp(B) % Let Fi(X), i=1...n, are objective functions % for minimization. % A point X* is said to be Pareto optimal one % if there is no X such that Fi(X)<=Fi(X*) for % all i=1...n, with at least one strict inequality. % A=prtp(B), % B - m x n input matrix: B= % [F1(X1) F2(X1) ... Fn(X1); % F1(X2) F2(X2) ... Fn(X2); % ....................... % F1(Xm) F2(Xm) ... Fn(Xm)] % A - an output matrix with rows which are Pareto % points (rows) of input matrix B. % [A,b]=prtp(B). b is a vector which contains serial % numbers of matrix B Pareto points (rows). % Example. % B=[0 1 2; 1 2 3; 3 2 1; 4 0 2; 2 2 1;... % 1 1 2; 2 1 1; 0 2 2]; % [A b]=prtp(B) % A = % 0 1 2 % 4 0 2 % 2 2 1 % b = % 1 4 7 A=[]; varargout{1}=[]; sz1=size(B,1); jj=0; kk(sz1)=0; c(sz1,size(B,2))=0; bb=c; for k=1:sz1 j=0; ak=B(k,:); for i=1:sz1 if i~=k j=j+1; bb(j,:)=ak-B(i,:); end end if any(bb(1:j,:)'<0) jj=jj+1; c(jj,:)=ak; kk(jj)=k; end end if jj A=c(1:jj,:); varargout{1}=kk(1:jj); else warning([mfilename ':w0'],... 'There are no Pareto points. The result is an empty matrix.') end return; 


 French
 Deutsch


![{\displaystyle \omega _{1}\in [0;1]~}](https://wikimedia.org/api/rest_v1/media/math/render/svg/99c8913e84daf282e85b04849cc18cc14594dda7)

