
 French
 Deutsch
File:Chart of COVID-19 vaccine doses administered in Mainland China.png - 维基百科,自由的百科全书
本预览的尺寸:800 × 565像素。 其他分辨率:320 × 226像素 | 640 × 452像素 | 1,024 × 723像素 | 1,280 × 904像素 | 2,560 × 1,807像素 | 3,400 × 2,400像素。
原始文件 (3,400 × 2,400像素,文件大小:343 KB,MIME类型:image/png)
摘要
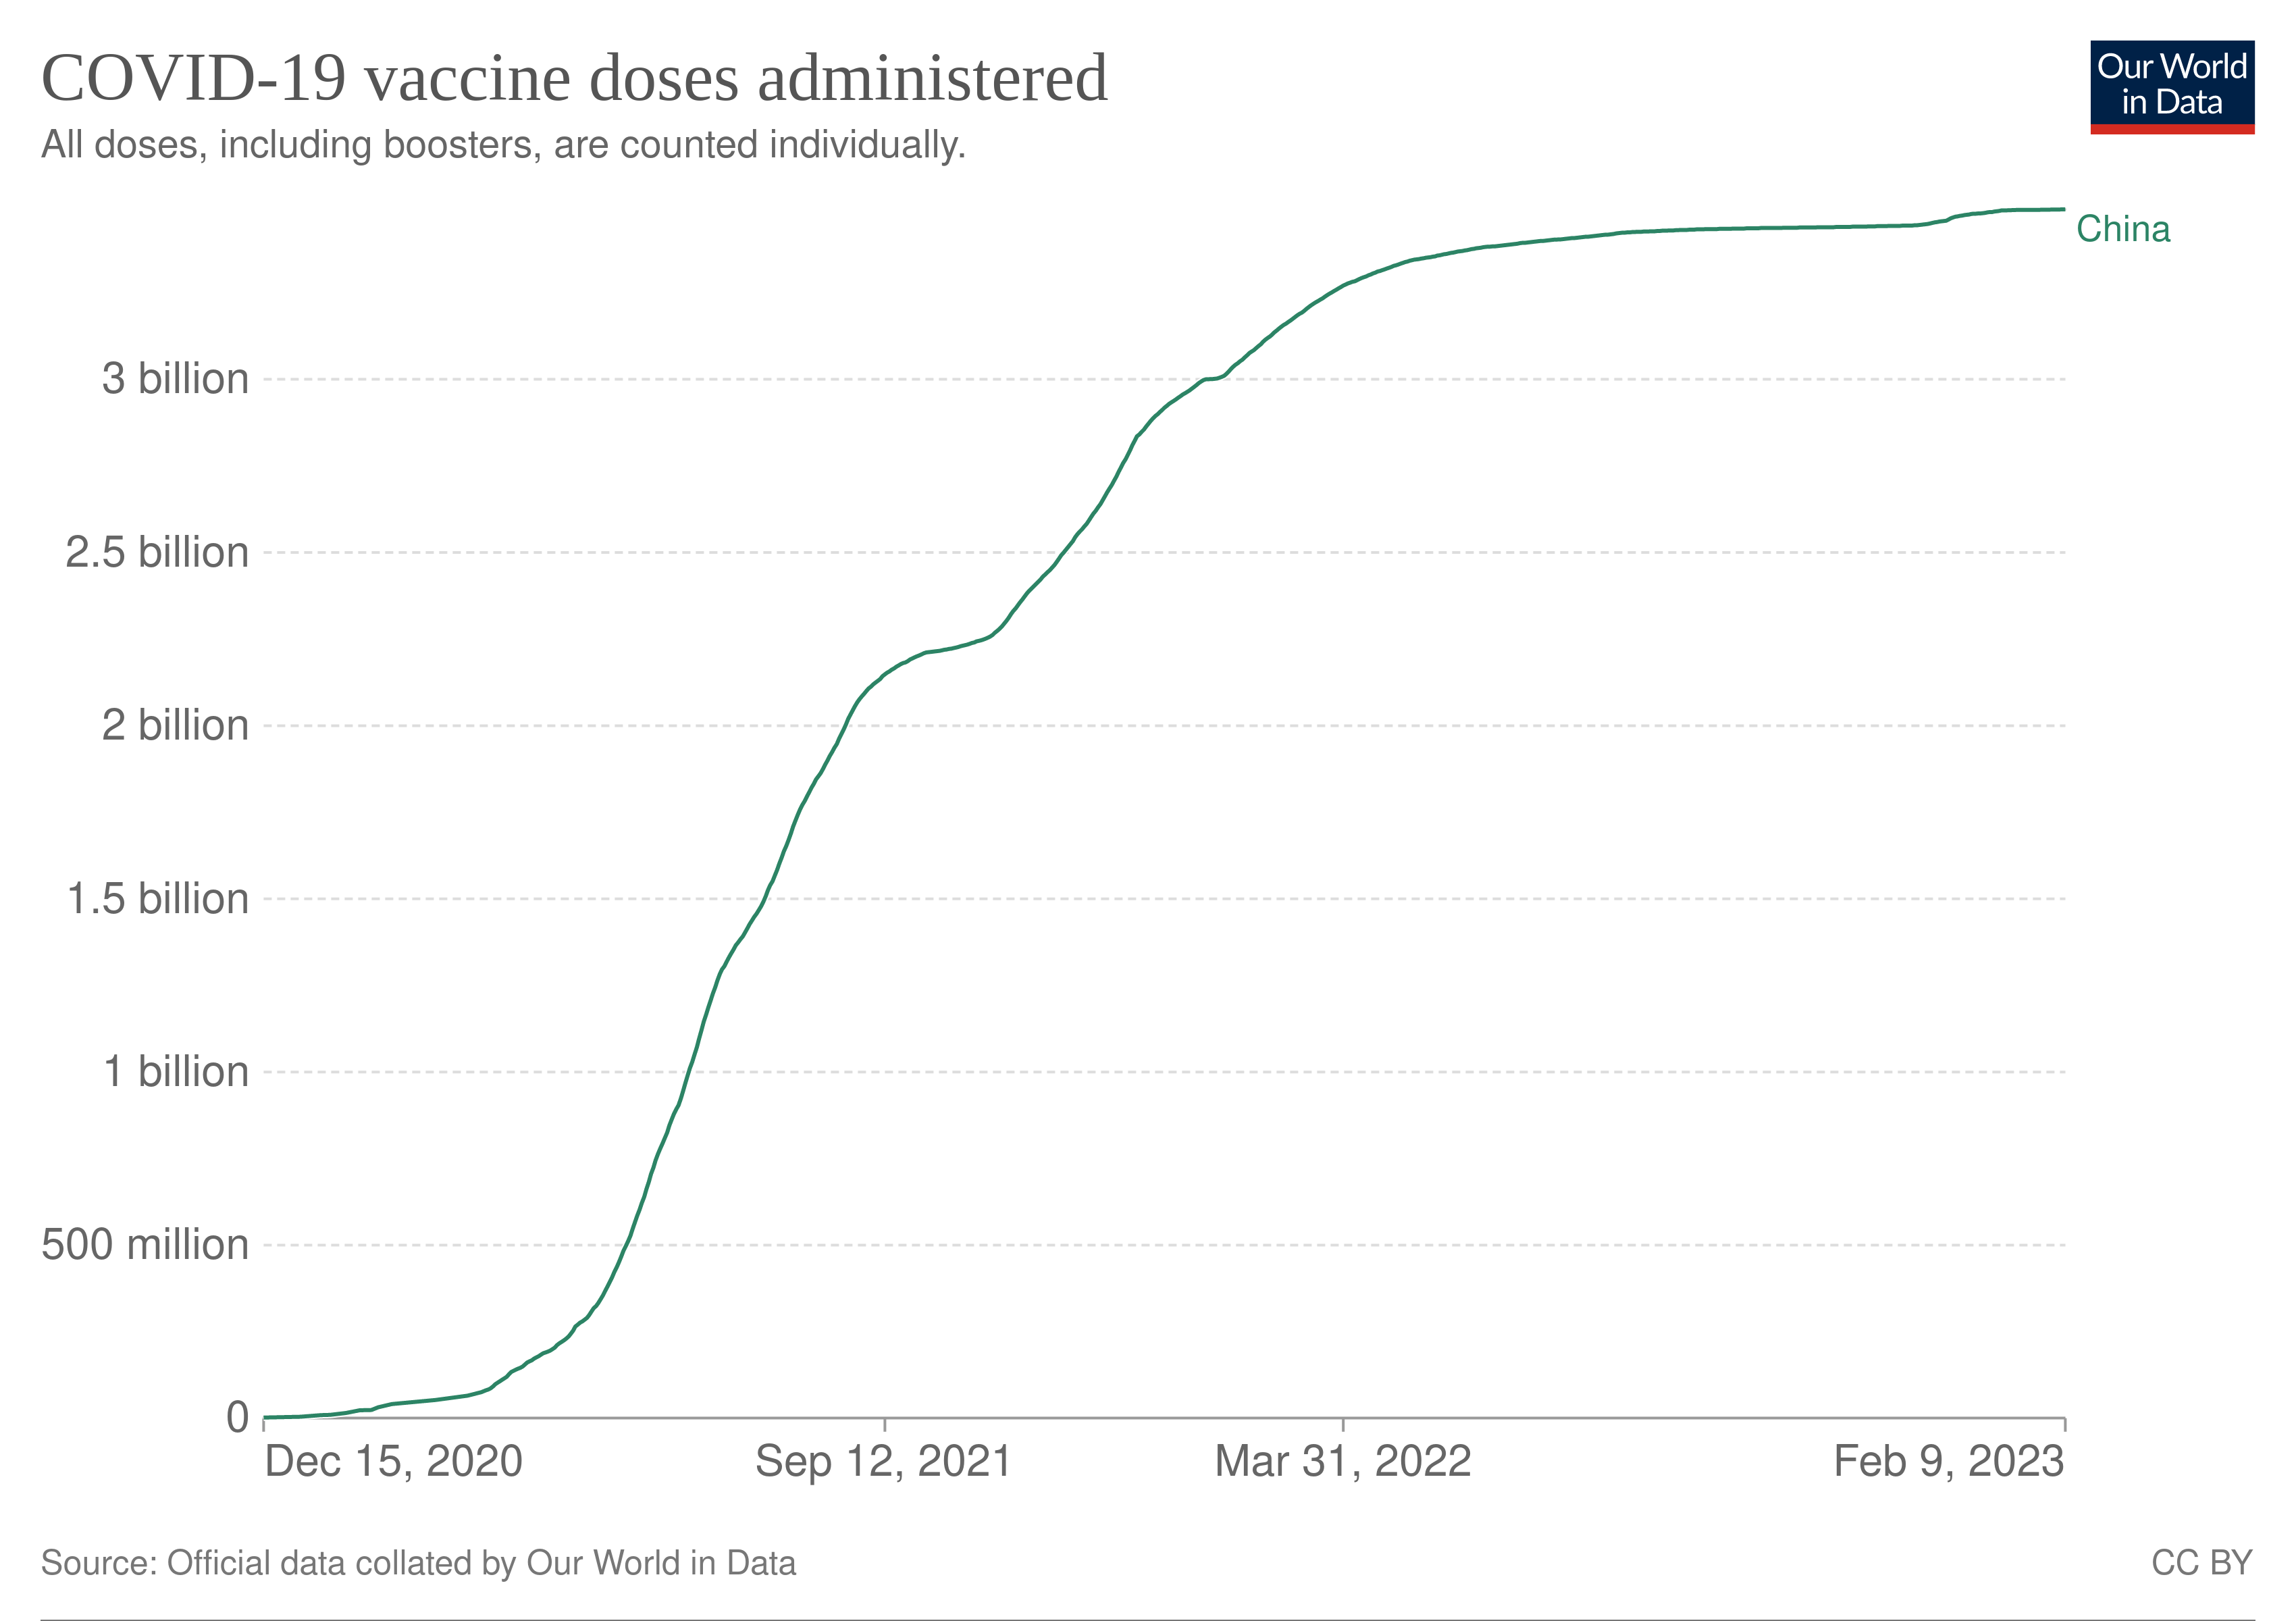
| 描述 | 中文:中国大陆COVID-19疫苗接种剂次数量曲线 |
| 来源 | https://ourworldindata.org/grapher/cumulative-covid-vaccinations?country=~CHN |
| 作者 | Our World in Data |
| 授权 (二次使用本文件) | https://ourworldindata.org/about |
许可协议
文件历史
点击某个日期/时间查看对应时刻的文件。
| 日期/时间 | 缩略图 | 大小 | 用户 | 备注 | |
|---|---|---|---|---|---|
| 当前 | 2023年8月1日 (二) 14:50 | | 3,400 × 2,400(343 KB) | Marion Moseby | Updated version from Our World in Data, same as others, and same license, too |
| 2021年8月28日 (六) 13:04 |  | 3,400 × 2,400(352 KB) | DreamerBlue | as of 08-27 | |
| 2021年7月30日 (五) 15:08 |  | 3,400 × 2,400(357 KB) | DreamerBlue | as of 7-30 | |
| 2021年7月10日 (六) 03:57 |  | 3,400 × 2,400(346 KB) | DreamerBlue | as of July 9 | |
| 2021年6月25日 (五) 13:09 |  | 3,400 × 2,400(344 KB) | DreamerBlue | as of 06-24 | |
| 2021年6月22日 (二) 13:10 |  | 3,400 × 2,400(347 KB) | DreamerBlue | as of 06-21 | |
| 2021年6月5日 (六) 02:44 |  | 3,400 × 2,400(238 KB) | Relic5064 | update | |
| 2021年6月2日 (三) 10:42 |  | 3,400 × 2,400(233 KB) | Relic5064 | update | |
| 2021年5月29日 (六) 09:07 |  | 3,400 × 2,400(233 KB) | Relic5064 | {{Information |Description = {{zh|中国大陆COVID-19疫苗接种剂次数量曲线}} |Source = https://ourworldindata.org/grapher/cumulative-covid-vaccinations?country=~CHN |Author = Our World in Data |Permission = https://ourworldindata.org/about }} |
文件用途
以下页面使用本文件:
全域文件用途
以下其他wiki使用此文件:
- en.wikipedia.org上的用途
- es.wikipedia.org上的用途