
 French
 Deutsch
File:Interpolation example spline.svg - 维基百科,自由的百科全书

此SVG文件的PNG预览的大小:600 × 480像素。 其他分辨率:300 × 240像素 | 960 × 768像素 | 1,280 × 1,024像素 | 2,560 × 2,048像素。
原始文件 (SVG文件,尺寸为600 × 480像素,文件大小:13 KB)
摘要
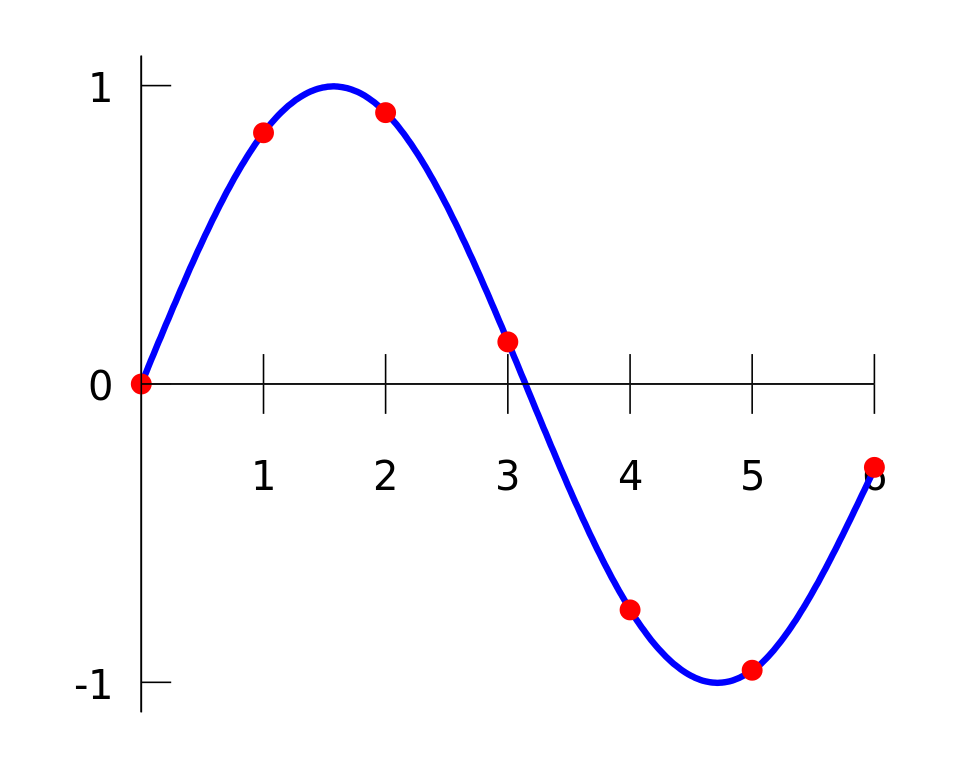
| 描述 | IIllustration of spline interpolation of a data set. The same data set is used for other interpolation algorithms in the Interpolation. |
| 日期 | |
| 来源 | self-made in Gnuplot |
| 作者 | Berland |
Based on png-version by User:Jitse Niesen (with gnuplot source code), and on svg-version by User:Cronholm144.
Gnuplot source code
set terminal svg fname "Vera" fsize 25 set output "Interpolation_example_spline.svg" set key off set xzeroaxis set xtics axis 1,1 set ytics nomirror 1 set samples 300 set border 2 f(x) = (x >= 0 && x < 1) ? -0.1522*x**3 + 0.9937*x : \ (x >= 1 && x < 2) ? -0.01258*x**3 - 0.4189*x**2 + 1.4126*x - 0.1396 : \ (x >= 2 && x < 3) ? 0.1403*x**3 - 1.3359*x**2 + 3.2467*x - 1.3623 : \ (x >= 3 && x < 4) ? 0.1579*x**3 - 1.4945*x**2 + 3.7225*x - 1.8381 : \ (x >= 4 && x < 5) ? 0.05375*x**3 -0.2450*x**2 - 1.2756*x + 4.8259 : \ -0.1871*x**3 + 3.3673*x**2 - 19.3370*x + 34.9282 set yrange [-1.1:1.1] plot f(x) with lines linetype 3 linewidth 4, \ "-" with points linetype 1 pointtype 7 pointsize 0.7,\ 0 with lines linetype -1 linewidth 1 0 0 1 0.8415 2 0.9093 3 0.1411 4 -0.7568 5 -0.9589 6 -0.2794 e
Please use at least version 4.2 of Gnuplot for smooth lines in SVG.
许可协议
| 本作品已被作者Berland释出到公有领域。这适用于全世界。 在一些国家这可能不合法;如果是这样的话,那么: Berland无条件地授予任何人以任何目的使用本作品的权利,除非这些条件是法律规定所必需的。 |
文件历史
点击某个日期/时间查看对应时刻的文件。
| 日期/时间 | 缩略图 | 大小 | 用户 | 备注 | |
|---|---|---|---|---|---|
| 当前 | 2007年6月25日 (一) 21:02 | | 600 × 480(13 KB) | Berland | {{Information |Description=Illustration of spline interpolation on a data set, compared with other interpolation methods in the article Interpolation. Based on png-version by User:Jitse Niesen and svg |
| 2007年6月23日 (六) 15:30 |  | 429 × 425(14 KB) | Cronholm144 | {{Information |Description=Interpolation example spline |Source=self-made |Date=06-23-07 |Author= Cronholm144 }} |
文件用途
以下页面使用本文件:
全域文件用途
以下其他wiki使用此文件:
- ar.wikipedia.org上的用途
- bs.wikipedia.org上的用途
- de.wikipedia.org上的用途
- en.wikipedia.org上的用途
- et.wikipedia.org上的用途
- eu.wikipedia.org上的用途
- fr.wikipedia.org上的用途
- hr.wikipedia.org上的用途
- hu.wikipedia.org上的用途
- it.wikipedia.org上的用途
- ja.wikipedia.org上的用途
- mn.wikipedia.org上的用途
- no.wikipedia.org上的用途
- simple.wikipedia.org上的用途
- sq.wikipedia.org上的用途
- ta.wikipedia.org上的用途
- ur.wikipedia.org上的用途