摘要
Basic R code
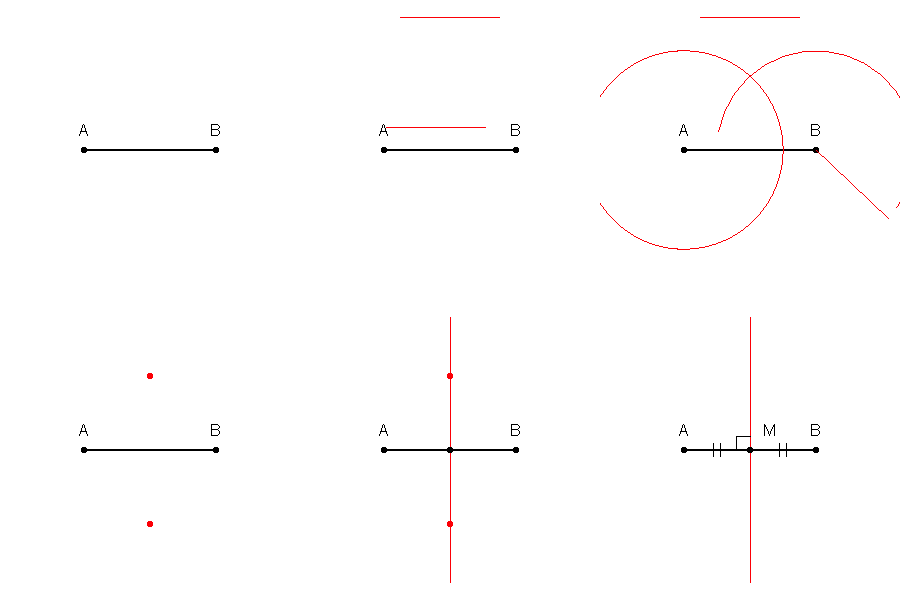
png(file="img%05d.png", width=300, height=300, pointsize = 16) plot.bk <- function(s){ d1 <<- 1 d2 <<- 1.5 My <<- sqrt(d2^2 - d1) pause <<- 1L:30L angL <<- 30 ang <<- seq(0,2*pi, length=angL) x1 <<- cos(ang)*d2 - d1 x2 <<- cos(ang+pi)*d2 + d1 y <<- sin(ang)*d2 arc <<- seq(0, 2*pi, length=angL*10) xarc1 <<- cos(arc)*d2 - d1 xarc2 <<- cos(arc+pi)*d2 + d1 yarc <<- sin(arc)*d2 par(mar=c(0,0,0,0)) plot(NULL, xlim=c(-2.1,2.1), ylim=c(-2.1,2.1), type="n", xaxt="n", yaxt="n", asp=1, frame.plot=F) lines(c(-1*d1,d1), c(0,0), lwd=2) points(c(-d1,d1), c(0,0), pch=20) text(-1,0.3,"A") text( 1,0.3,"B") if(s == 1) {return()} lines(c(-1*d2/2,d2/2), c(2,2), lwd=1, col=2) if(s == 2) {return()} # lines(c(-1,x1[length(x1)]), c(0,y[length(y)]), lwd=1, col=2) lines(xarc1[1:length(xarc1)], yarc[1:length(yarc)], col=2) if(s == 3) {return()} # lines(c( 1,x2[length(x2)]), c(0,y[length(y)]), lwd=1, col=2) lines(xarc2[1:length(xarc1)], yarc[1:length(yarc)], col=2) if(s == 4) {return()} points(c(0,0), c(My,-1*My), pch=20, col=2) if(s == 5) {return()} } for(i in pause){plot.bk(1)} for(i in pause){plot.bk(2)} lp.x <- seq(-1*d2/2,-1*d1,length=length(pause)) lp.y <- seq(2,0,length=length(pause)) for(i in pause){ plot.bk(2) lines(c(lp.x[i], lp.x[i]+d2), c(lp.y[i], lp.y[i]), col=2) } # 左紅一圓 for(i in 1:angL){ plot.bk(2) lines(c(-1*d1,x1[i]), c(0,y[i]), lwd=1, col=2) lines(xarc1[1:(i-1)*10], yarc[1:(i-1)*10], col=2) } lp.x <- seq(-1*d2/2,d1-d2,length=length(pause)) lp.y <- seq(2,0,length=length(pause)) for(i in pause){ plot.bk(3) lines(c(lp.x[i], lp.x[i]+d2), c(lp.y[i], lp.y[i]), col=2) } for(i in 1:angL){ plot.bk(3) lines(c( d1,x2[i]), c(0,y[i]), lwd=1, col=2) lines(xarc2[1:(i-1)*10], yarc[1:(i-1)*10], col=2) } for(j in pause){plot.bk(4)} for(j in pause){plot.bk(5)} for(j in pause){ plot.bk(1) points(c(0,0), c(My,-1*My), pch=20, col=2) } Myy <- seq(2, -2, length=length(pause)) for(j in pause){ plot.bk(1) points(c(0,0), c(My,-1*My), pch=20, col=2) lines(c(0,0), c(Myy[1], Myy[j]), col=2) } for(j in pause){ plot.bk(1) points(c(0,0), c(My,-1*My), pch=20, col=2) lines(c(0,0), c(Myy[1], Myy[length(Myy)]), col=2) } for(j in pause){ plot.bk(1) points(c(0,0), c(My,-1*My), pch=20, col=2) lines(c(0,0), c(Myy[1], Myy[length(Myy)]), col=2) points(0,0,pch=20, col=1) } for(j in rep(pause, 2)){ plot.bk(1) lines(c(0,0), c(Myy[1], Myy[length(Myy)]), col=2) text(0.3,0.3, "M", col=1) points(0,0,pch=20, col=1) lines(c(-0.45,-0.45), c(0.1,-0.1)) lines(c(-0.55,-0.55), c(0.1,-0.1)) lines(c(0.45, 0.45), c(0.1,-0.1)) lines(c(0.55, 0.55), c(0.1,-0.1)) lines(c(0,-0.2), c(0.2,0.2)) lines(c(-0.2,-0.2), c(0.2,0)) } dev.off() 许可协议
我,本作品著作权人,特此采用以下许可协议发表本作品:
  | 本作品采用知识共享CC0 1.0 通用公有领域贡献许可协议授权。 |
| 采用本宣告发表本作品的人,已在法律允许的范围内,通过在全世界放弃其对本作品拥有的著作权法规定的所有权利(包括所有相关权利),将本作品贡献至公有领域。您可以复制、修改、传播和表演本作品,将其用于商业目的,无需要求授权。 http://creativecommons.org/publicdomain/zero/1.0/deed.enCC0Creative Commons Zero, Public Domain Dedicationfalsefalse |


 French
 Deutsch
