
 French
 Deutsch
File:Symmetricwave2.png - 维基百科,自由的百科全书

本预览的尺寸:800 × 599像素。 其他分辨率:320 × 240像素 | 640 × 479像素 | 1,024 × 767像素 | 1,280 × 958像素 | 1,811 × 1,356像素。
原始文件 (1,811 × 1,356像素,文件大小:540 KB,MIME类型:image/png)
 | 此physics图片可使用矢量图形重新创建为SVG文件。这具有很多好处;更多信息请参见共享资源:待清理媒体。如果存在此图片的SVG格式,请将其上传,然后将此模板替换为 {{vector version available|新图片名称}}。 建议您将SVG命名为“Symmetricwave2.svg”,这样在使用Vector version available(或Vva)模板时就不需要填写新图片名称参数。 |
摘要
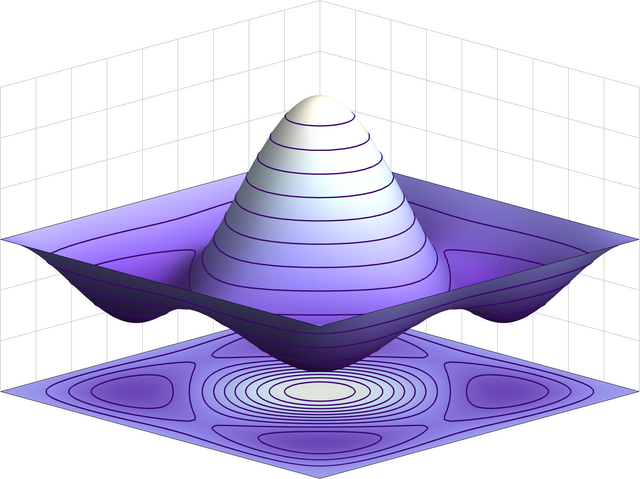
| 描述 | English: Symmetric wavefunction for a (bosonic) 2-particle state in an infinite square well potential. |
| 来源 | 自己的作品 |
| 作者 | TimothyRias |
许可协议
我,本作品著作权人,特此采用以下许可协议发表本作品:
本文件采用知识共享署名 3.0 未本地化版本许可协议授权。
- 您可以自由地:
- 共享 – 复制、发行并传播本作品
- 修改 – 改编作品
- 惟须遵守下列条件:
- 署名 – 您必须对作品进行署名,提供授权条款的链接,并说明是否对原始内容进行了更改。您可以用任何合理的方式来署名,但不得以任何方式表明许可人认可您或您的使用。
摘要
This 3D graph shows the wavefunction for the 2-particle bosonic state for the one dimensional infinite square well at the same energy as the fermionic 2-particle groundstate. (See for example D.J. Griffiths, Introduction to quantum mechanics, Prentice Hall , 1995, section 5.1.1) The picture was created using Mathematica 6.0 using the following code:
$Assumptions = {n \[Element] Integers, m \[Element] Integers}; f[n_, x_] := Sqrt[2] Sin[n \[Pi] x]; s[n_, m_] := Function[{x, y}, (f[n, x] f[m, y] + f[n, y] f[m, x])/Sqrt[2]]; swave2 = Plot3D[Evaluate[-s[3, 1][x, y]], {x, 0, 1}, {y, 0, 1}, PlotPoints -> 35, PlotRange -> {-2.5, 3.5}, MeshFunctions -> {#3 &}, MeshStyle -> Directive[ColorData["DeepSeaColors"][.1], Thickness[.002]], Mesh -> 10, ColorFunction -> "LakeColors", BoxRatios -> {1, 1, .7}, Boxed -> False, Axes -> False]; sgroundplot = Plot3D[-3, {x, 0, 1}, {y, 0, 1}, MeshFunctions -> {s[1, 3][#1, #2] &}, Mesh -> 10, MeshStyle -> Directive[ColorData["DeepSeaColors"][.1], Thickness[.002]], PlotPoints -> 50, ColorFunction -> (ColorData["LakeColors"][(-s[1, 3][#1, #2] + 2.5)/ 6] &)]; swave3 = Show[{swave2, sgroundplot}, PlotRange -> {{0, 1}, {0, 1}, {-3, 3}}, Axes -> None, PlotRangePadding -> None, ImagePadding -> 1, FaceGrids -> { {{-1, 0, 0}, {Table[i, {i, 0, 1, 1/9}], Table[i, {i, -3, 3, 1}]}}, {{0, -1, 0}, {Table[i, {i, 0, 1, 1/9}], Table[i, {i, -3, 3, 1}]}} }, ViewPoint -> 1000 {5, 5, 2}, ViewVertical -> {0, 0, 1}, ViewCenter -> {.5, .5, 0}, ImageSize -> 600] Export["Symmetricwave2.png", swave3, "PNG"]
文件历史
点击某个日期/时间查看对应时刻的文件。
| 日期/时间 | 缩略图 | 大小 | 用户 | 备注 | |
|---|---|---|---|---|---|
| 当前 | 2024年2月19日 (一) 15:52 | | 1,811 × 1,356(540 KB) | Jähmefyysikko | Antialiasing and higher resolution |
| 2008年10月15日 (三) 13:18 |  | 600 × 450(79 KB) | TimothyRias | {{Information |Description= |Source= |Date= |Author= |Permission= |other_versions= }} Category:Physics plots | |
| 2008年10月7日 (二) 14:52 |  | 360 × 286(25 KB) | TimothyRias | {{Information |Description={{en|1=Symmetric wavefunction}} |Source=Own work by uploader |Author=TimothyRias |Date= |Permission= |other_versions= }} <!--{{ImageUpload|full}}--> |
文件用途
全域文件用途
以下其他wiki使用此文件:
- ar.wikipedia.org上的用途
- ast.wikipedia.org上的用途
- ca.wikipedia.org上的用途
- da.wikipedia.org上的用途
- en.wikipedia.org上的用途
- eu.wikipedia.org上的用途
- fa.wikipedia.org上的用途
- ga.wikipedia.org上的用途
- hy.wikipedia.org上的用途
- ja.wikipedia.org上的用途
- ko.wikipedia.org上的用途
- pa.wikipedia.org上的用途
- pl.wikipedia.org上的用途
- ro.wikipedia.org上的用途
- ru.wikipedia.org上的用途
- sr.wikipedia.org上的用途
- th.wikipedia.org上的用途
- uk.wikipedia.org上的用途
- uz.wikipedia.org上的用途
- www.wikidata.org上的用途
- zh-yue.wikipedia.org上的用途